For brands
For in-house teams, we connect your data, model your channels and work with you from the first brief through to weekly planning and optimisation. You can license the platform or choose to work with our team.
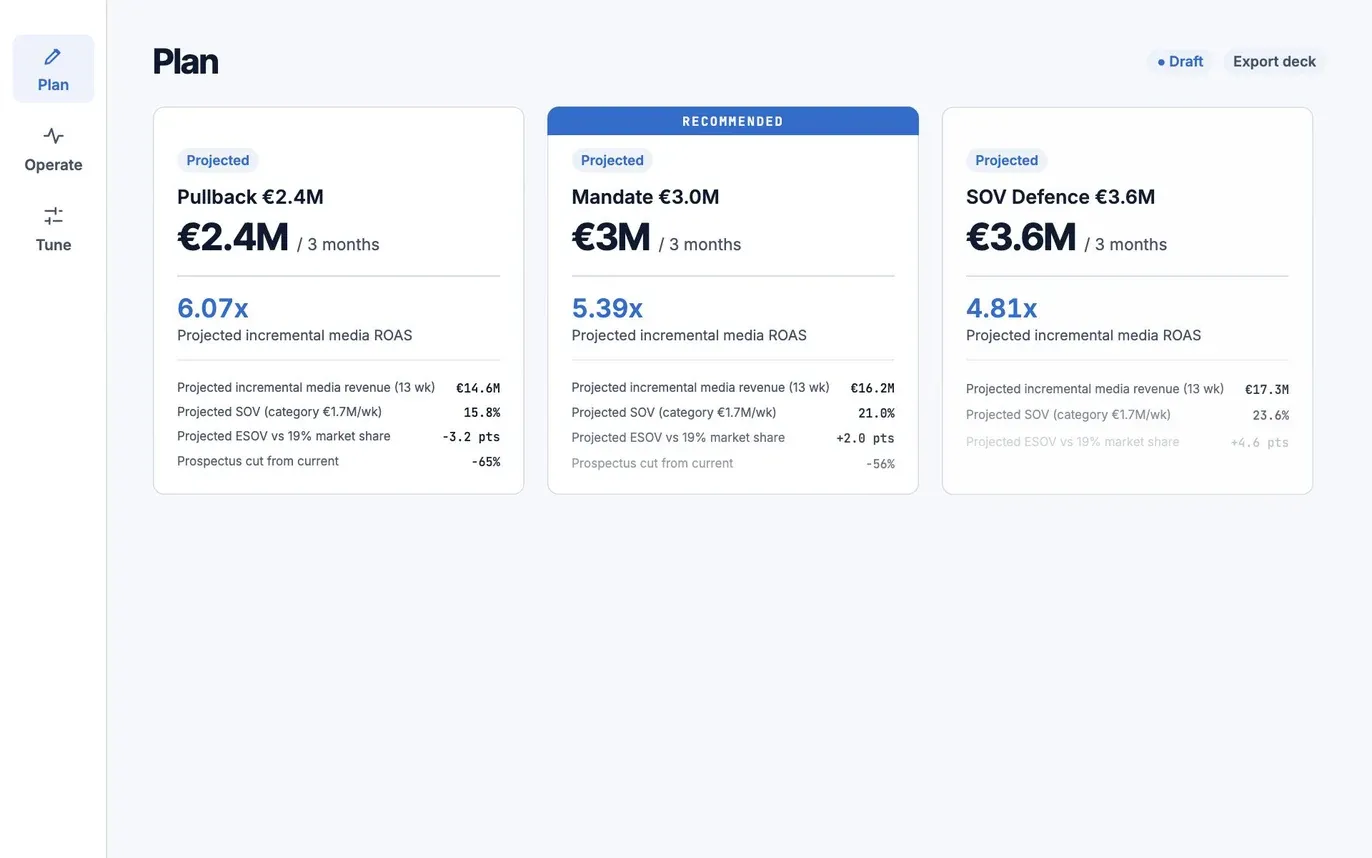
Response curves show which channels have moved beyond their most efficient range. The plan estimates the likely impact of reducing spend, with an uncertainty range.
Allocation is guided by marginal incremental ROAS rather than platform-reported ROAS, while experiments progressively replace modelled figures with measured results.
Figures show their source and recommendations show their confidence level. Weekly and monthly reports provide a clear basis for management discussion.
Attribution can overlap across channels, and reported ROAS can overstate the value of channels that are already saturated. Annual plans are often revisited only once, while traditional consultancy projects can take months and be outdated by the time they conclude.
A Bayesian model with response curves for each channel. Allocations can follow marginal incremental ROAS rather than an average return, while the model card and its assumptions remain available for review.
Review pacing, funnel progression and channel status against the plan, with each figure identified as measured or projected. A weekly report explains what has changed and the actions to consider.
Recommendations set out their hypothesis, proposed action, expected impact and confidence level. Experiments can be proposed from the first plan, helping replace modelled figures with measured results as evidence develops.
Where data is limited, audited benchmarks provide a starting point. Figures are clearly identified, and a first plan can be prepared within an hour.
A geo holdout, a conversion lift or an A/B test that replaces the weakest modelled number with a measured one.
As new evidence becomes available, the team can monitor, refine and re-plan. Over time, the model increasingly relies on your own data and the plan on the model.
Your team runs the planner with onboarding and setup scoped to your situation. You can move to managed optimisation whenever you would like our team to take on more of the work.
See pricing →Our marketing scientists connect your data, build the models and work with you each week on planning and optimisation.
How we work with you →Platform dashboards report attributed sales. Attribution overlaps across channels, and reported ROAS stays high on channels that are already saturated. Kuwalyst connects to your data sources, so the same platform figures are available per channel and aggregated, for online and offline channels alike. It then combines them with a media mix model and experiments, and tags every figure as measured, projected or benchmark, so budget decisions rest on evidence.
Yes. Benchmark-led plans start from your brief plus an audited registry of published benchmarks, every claim verified against primary sources. Each figure is tagged, and the plan states what to test first, so your own evidence replaces benchmarks over time.
That works well. Kuwalyst can operate alongside your agency, and many agencies use the same planner for their clients. In either case, the plan, model and supporting evidence remain in your workspace.
Tell us where your media plan lives today—even a spreadsheet is a useful starting point. We will show you how planning, monitoring and optimisation could work in your situation.
Talk to us