Marginal incremental ROAS
Marginal incremental ROAS focuses on the return from the next euro of spend. It considers only sales that would not otherwise have happened, rather than the average return reported across all spend, so channels can be compared more meaningfully.
7 min read · Updated September 7, 2026
What it is
Return on ad spend is revenue attributed to a channel divided by what was spent on it. Marginal incremental ROAS makes two corrections to it.
Incremental restricts the revenue to sales that would not have happened without the advertising. The counterfactual, what would have happened anyway, has to come from somewhere: a model that separates media from baseline, or an experiment that holds a group out.
Marginal replaces the ratio over all spend with the slope at the current spend: the revenue the next euro will bring, divided by that euro. On a response curve, it is the tangent rather than the line from the origin.
The result is the one number that ranks channels for the next euro. It is also the number a plan moves budget on.
Why it matters for a media plan
Every reallocation decision is a comparison between the next euro on channel A and the next euro on channel B. Average return does not answer it, because the average includes the euros that were spent when the channel was fresh. Incremental average return is closer, but still an average. Marginal incremental return is the answer.
It changes what “performing” means. A channel performs when its marginal incremental return is above the brand’s breakeven and above the alternatives, whatever its dashboard ROAS says. A channel can be a historical success and a current mistake at the same time.
How it works
From a fitted media mix model, each channel has a response curve in revenue. The marginal return at the committed spend x is:
marginal iROAS(x) = ( revenue(x + δ) − revenue(x) ) / δ
for a small δ, computed on every posterior draw so it carries a band. The incremental part is built in: the model’s revenue is the media contribution, net of baseline, seasonality and controls.
From an experiment, the incremental return is measured directly for the spend level that was tested: incremental revenue in the test group divided by the spend. It is an average over the tested range rather than a slope, but it is measured, and it calibrates the model’s curve at that point.
The practical rule for a plan is to rank channels by marginal incremental return, move budget from the bottom of the ranking to the top until the slopes meet, and stop where a channel hits its cap or the end of the range the model knows.
How Kuwalyst uses it
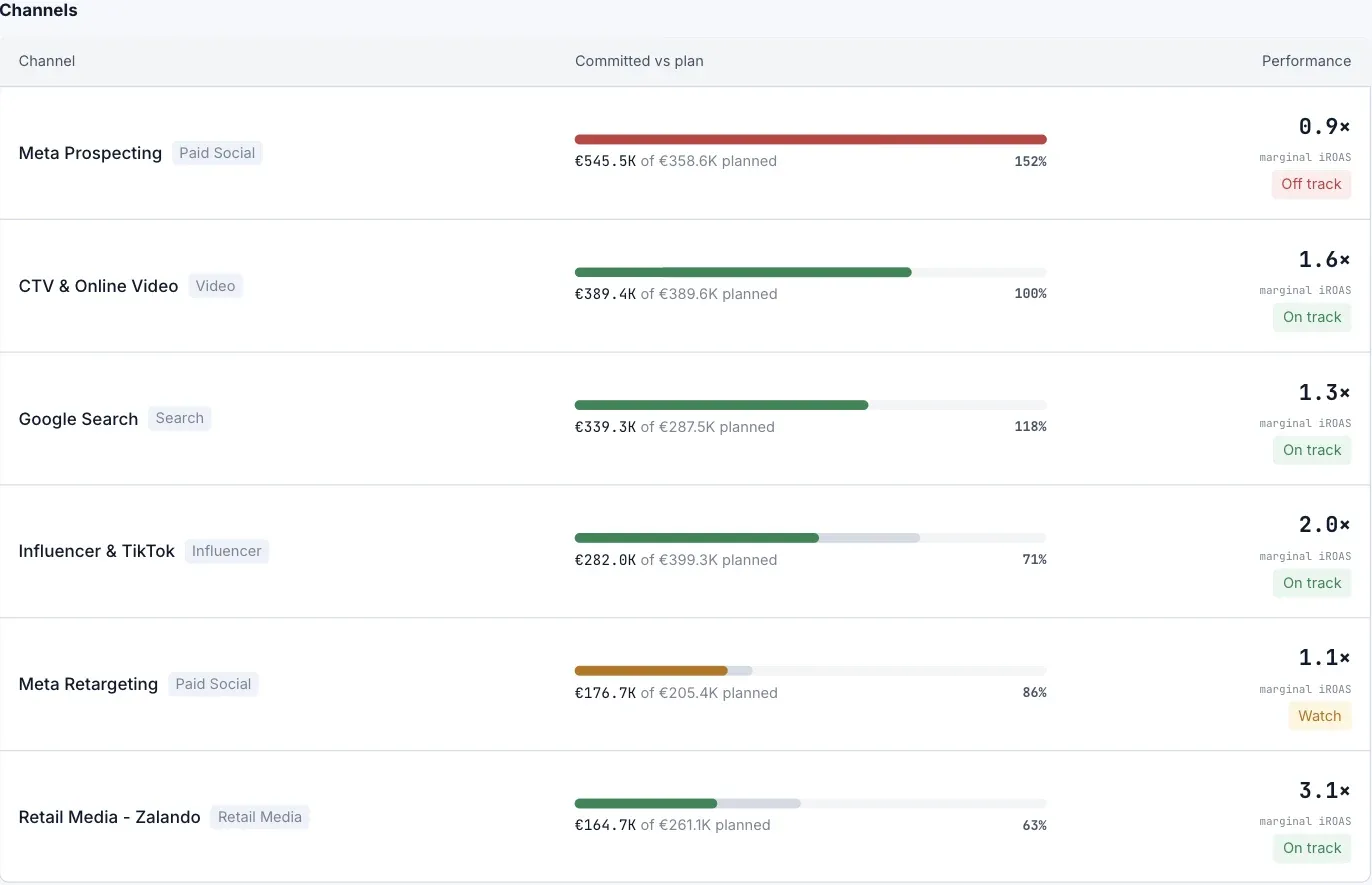
The Operate view shows every channel with its marginal iROAS next to its committed spend, and a status: on track, watch, off track. A channel overspending its plan at 0.9× marginal is flagged off track even if its dashboard ROAS looks fine, because the next euro there is losing money.
Recommendations in the Tune view are sized on the slopes. “Shift 15% of budget from channel A to channel B” comes with the marginal return of each, the amount that can move before B reaches its own knee, and the projected impact with its band. Where the model’s slope is too uncertain to act on, the recommendation is a measurement instead: the geo holdout that would pin the number down.
Every marginal figure carries its tag. Modelled when it comes from the curve, measured when it comes from a test, benchmark when the plan is running on published values because the brand has no history yet.
Pitfalls
Mixing definitions: a deck that compares platform ROAS on one channel with incremental ROAS on another compares different quantities. The registry and the plan keep the tags on so this cannot happen quietly.
Marginal at what spend? The slope depends on where you read it. A marginal return quoted without the spend level it was read at means nothing.
Short-term marginal, long-term brand: a slope read on a four-week window under-counts channels whose effect builds over months. The model’s adstock handles some of this; the plan should say how much of a channel’s return is deferred.
Rank, then check: a ranking of slopes is only as good as the curves. The channel at the top of the list is the first to test.
See it in the product